Configuring Sentry
Let’s face it—your code is going to break. It happens to all of us. The question is: how fast can you fix it when it does? In this section, we’ll add Sentry to our Next.js application so we can catch those errors in the wild before our users start tweeting about them.
Setting Up Sentry
-
Run the Sentry CLI Wizard
Get Sentry integrated with our ErrorFix application quickly:
Terminal window npx @sentry/wizard@latest -i nextjsThis wizard will:
- Connect to your Sentry account
- Set up configuration files
- Create an example error page to test your setup
-
Complete the Authentication Process
When you run the command, you’ll be prompted to authenticate:
- Choose between browser login (easiest) or an auth token
- If you don’t have a token handy, just go with the browser option
- The wizard will open your browser and let you log in to Sentry
-
Select or Create a Project
Choose your Sentry project:
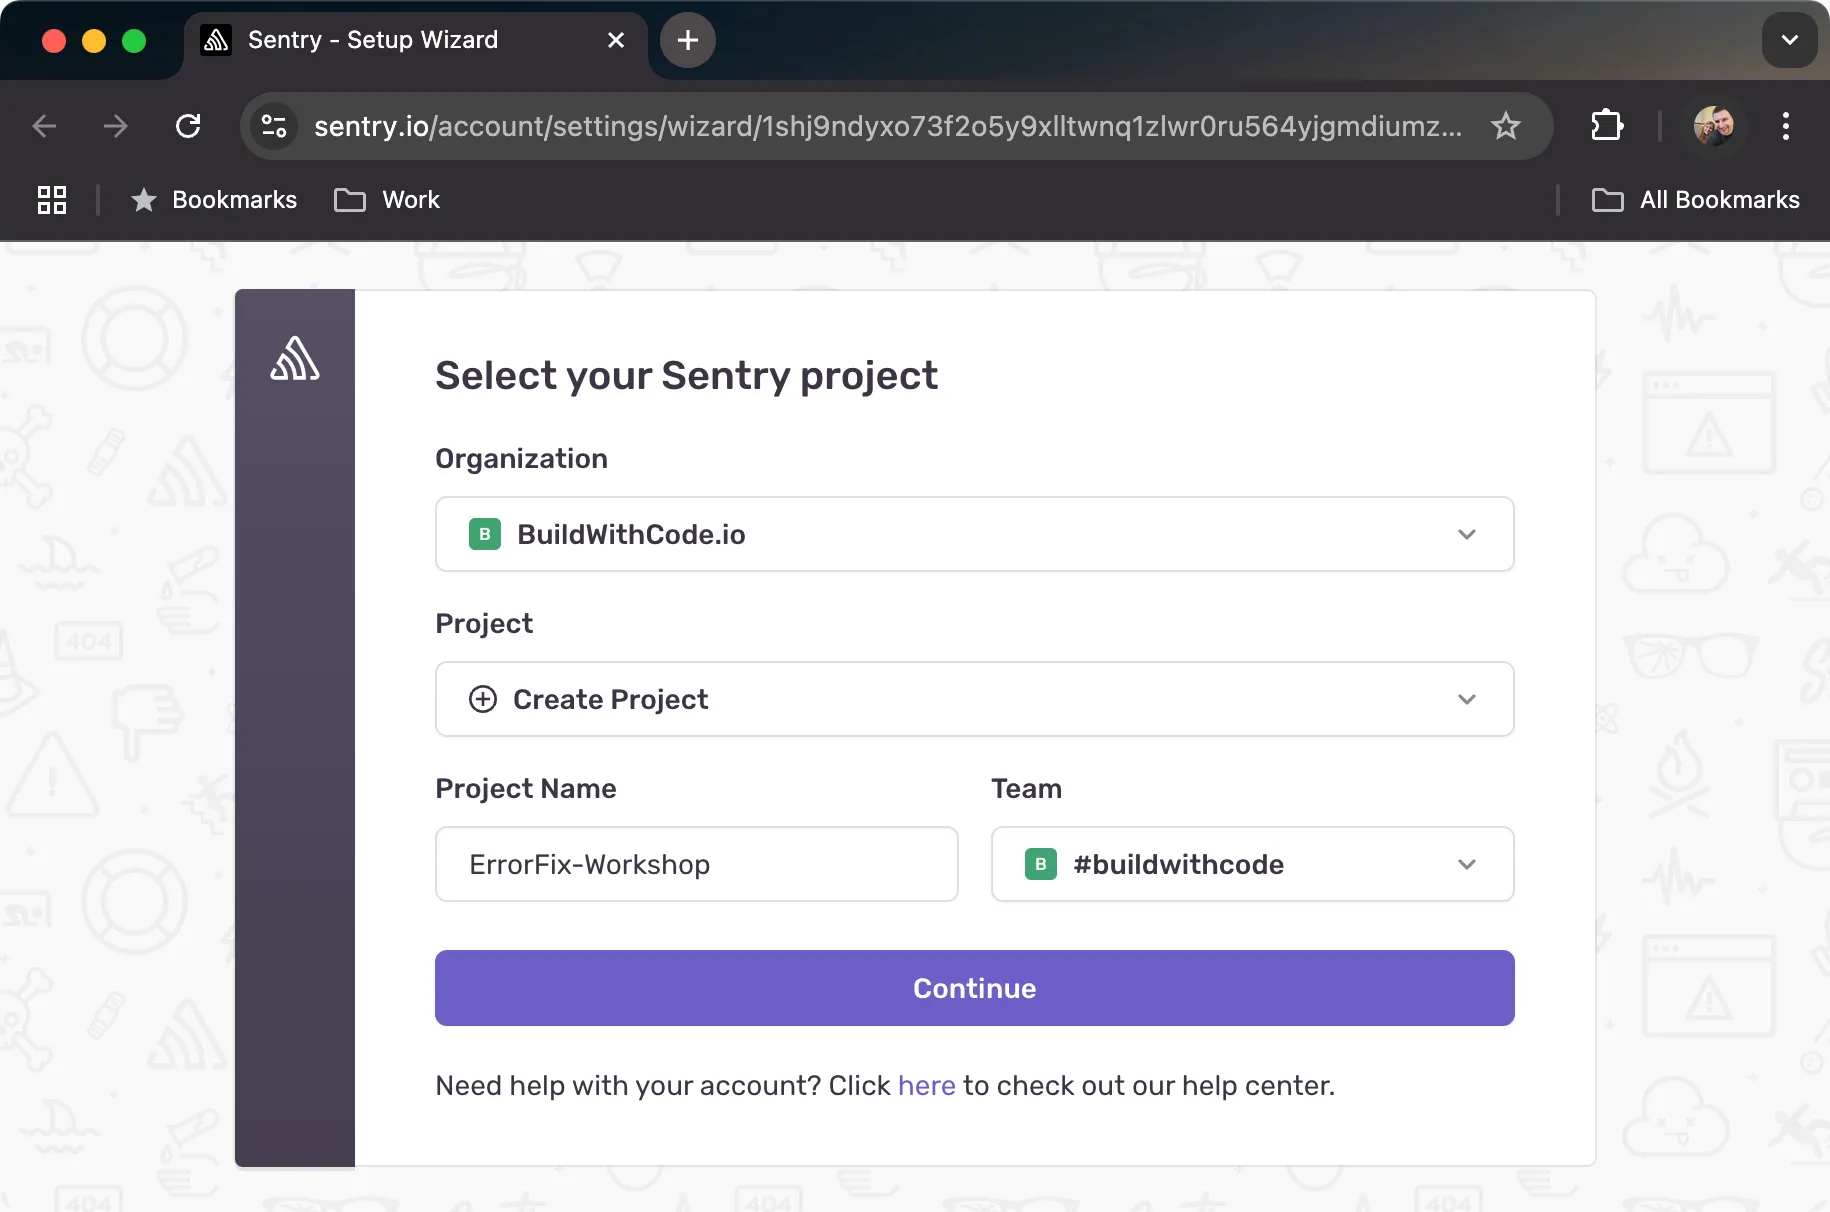
- If you don’t have one yet, the wizard can create it for you
- Select “Next.js” as the platform
-
Choose Features to Enable
You’ll be asked which features to enable:
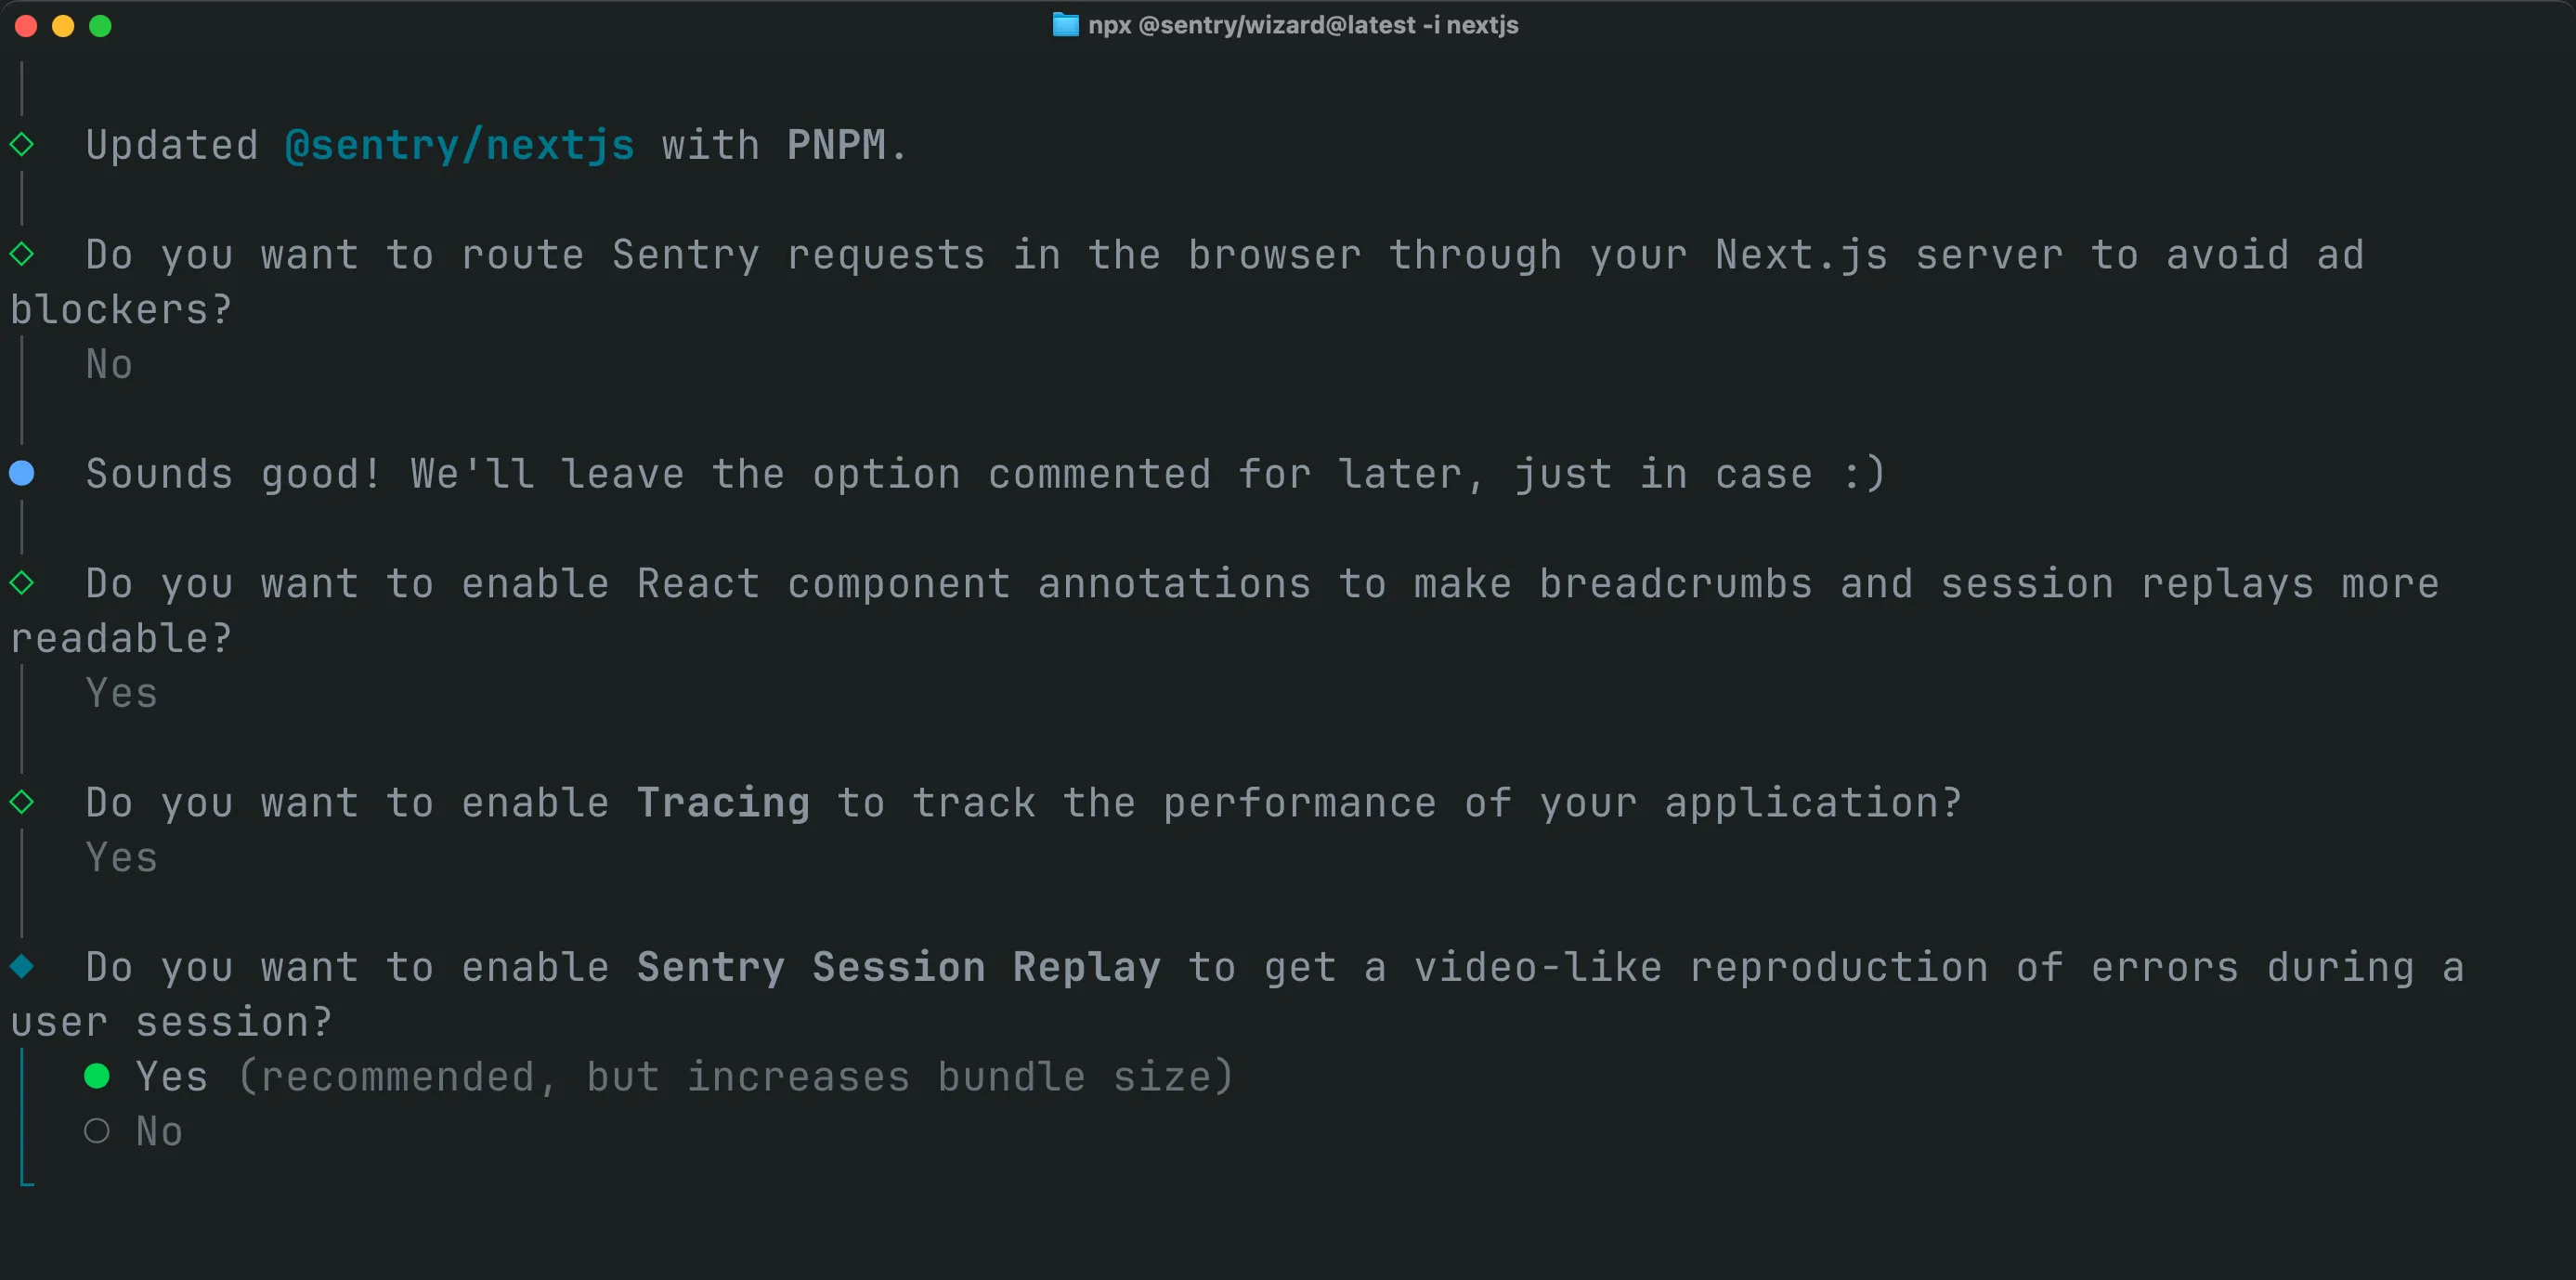
- Error Monitoring: Enable to catch runtime errors
- Performance Monitoring: Enable to track app performance
- Replays: Enable to see visual recreations of user sessions
Understanding Sentry Features
Learn More: Error Monitoring
Error monitoring is the core functionality of Sentry. It allows you to:
- Capture unhandled exceptions in real-time
- See detailed stack traces
- Get context about the user and environment
- Track error frequency and impact
- Assign errors to team members for resolution
When an error occurs, Sentry will show you:
- The exact line of code that failed
- What function was being executed
- The sequence of function calls leading to the error
- What browser/device the user was using
- Custom context you’ve added to your app
This is essential for quickly identifying and fixing critical issues before they affect more users.
Learn More: Performance Monitoring
Performance monitoring helps you track how your application performs for real users:
- Track page load times
- Monitor API call durations
- Identify slow database queries
- See frontend rendering performance
- Set performance thresholds and alerts
Sentry’s performance monitoring creates “transactions” for each significant operation in your app. Each transaction contains “spans” representing smaller operations within it.
This allows you to:
- See which parts of your application are running slowly
- Track performance over time
- Compare performance across different pages and features
- Identify performance regressions after deployments
- Correlate performance issues with errors
By monitoring performance, you can ensure your application not only works but works efficiently.
Learn More: Replays
Replays are like having a video recording of what your users experienced:
- Watch recreations of user sessions leading up to errors
- See exactly what users saw and did
- Identify UI/UX issues that lead to confusion
- Understand complex user interactions that trigger bugs
- Reproduce hard-to-track errors
Replays captures:
- DOM changes
- User interactions (clicks, scrolls, form inputs)
- Console logs
- Network requests
Privacy features ensure sensitive data isn’t captured:
- Automatic PII masking
- Customizable privacy rules
- Consent-based recording
This feature dramatically reduces time spent trying to reproduce issues, especially those that depend on specific user interactions or state sequences.
What Gets Added to Your Project
-
Configuration Files for Every Environment
The wizard creates specific config files for different execution contexts:
sentry.client.config.js- For browser errorssentry.server.config.js- For server-side rendering/API routessentry.edge.config.js- For edge functions
Here’s what the client configuration looks like:
sentry.client.config.js import * as Sentry from '@sentry/nextjs';Sentry.init({dsn: "https://your-public-dsn@o0.ingest.sentry.io/0",// Capture all errors in developmenttracesSampleRate: 1.0,// Record 10% of normal sessions, but all error sessionsreplaysSessionSampleRate: 0.1,replaysOnErrorSampleRate: 1.0,// Replays are only available in the browserintegrations: [Sentry.replayIntegration()],}); -
Updated Next.js Configuration
Sentry modifies your Next.js config:
- Adds Sentry’s webpack plugin to
next.config.js - Configures source map uploads
- Sets up error handling middleware
next.config.js const { withSentryConfig } = require('@sentry/nextjs');const nextConfig = {// Your existing config stays here};module.exports = withSentryConfig(nextConfig,{silent: true, // Less console noise during buildsorg: "your-organization",project: "your-project",reactComponentAnnotation: {enabled: true,},}); - Adds Sentry’s webpack plugin to
-
App Router Instrumentation
Creates or updates
instrumentation.tsfor App Router support:instrumentation.ts export async function register() {if (process.env.NEXT_RUNTIME === "nodejs") {await import("./sentry.server.config");}if (process.env.NEXT_RUNTIME === "edge") {await import("./sentry.edge.config");}} -
Example Error Page
Adds a test page at
/sentry-example-pageto verify error capturing
Testing Your Setup
-
Start Your Next.js App
Launch your development server:
Terminal window npm run dev -
Visit the Example Page
Navigate to the example page created by the wizard (typically
/sentry-example-page)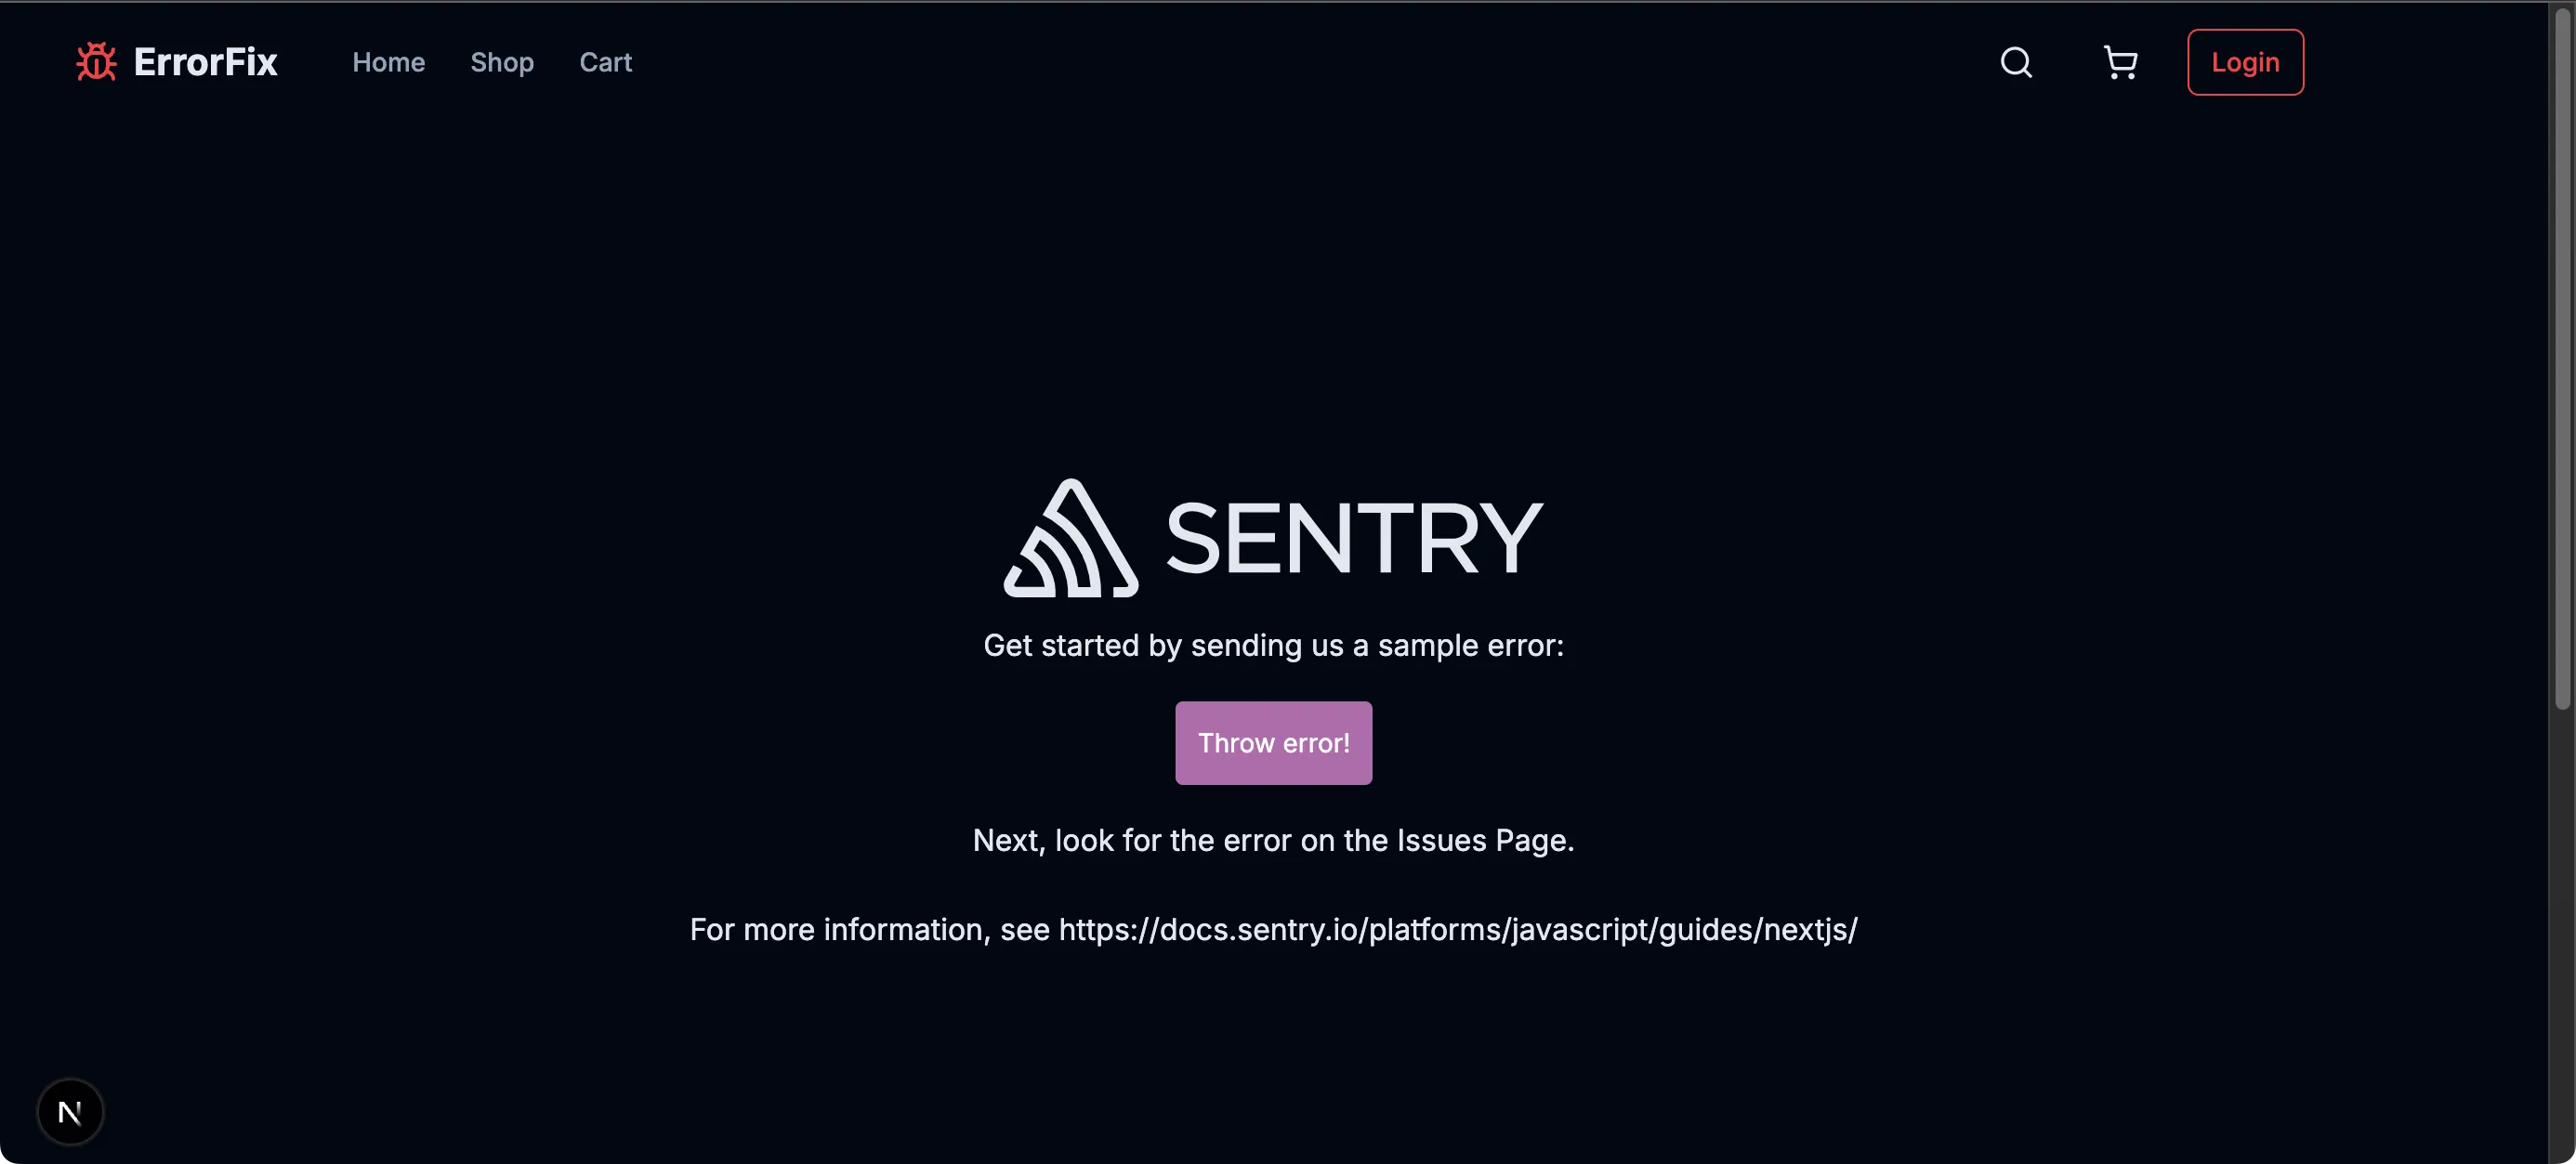
-
Trigger Test Errors
The example page lets you generate different types of errors:
- Client-side errors
- Server-side errors
- API route errors
Click the buttons to trigger errors and see how they appear in your Sentry dashboard.
-
Verify in Sentry Dashboard
Log in to your Sentry account and check the “Issues” section to see the errors you’ve triggered. You should see detailed information about each error, including:
- Stack traces
- Browser/OS information
- Request data
- User context (if configured)
Next Steps
Now that Sentry is configured in your application, you’re ready to start the workshop exercises. These will guide you through common error scenarios and show you how to use Sentry to diagnose and fix them.
Head to the Code Breaks section to start your debugging journey.